Nyquist analysis and the pyquist module
My collaborators and I recently published a paper in which we determined frequencies of stellar oscillations that were severely undersampled in time series data. That paper, Destroying Aliases from the Ground and Space: Super-Nyquist ZZ Cetis in K2 Long Cadence Data, thoroughly explores the ways that observational sampling affects the signatures of stellar pulsations, but I thought it might be useful to lay out some of the basic ideas and tools behind this type of analysis (including a python module: pyquist).
The signal processing problem of Nyquist aliasing is well demonstrated by film. Video is regularly sampled time series data. Have you ever noticed a rapidly rotating object, such as an aircraft propeller, appearing to rotate slowly or backwards, or to even stand still in a movie? It sure can look strange!
This effect is due to a mismatch between the low playback rate of film and the rapid rate of motion of the observed object. If more than half a cycle is executed between each observation, the perceived rate (and possibly direction) of motion will be wrong.
This is referred to as the “wagon-wheel” effect or stroboscopic effect and it has both curious and practical consequences. One safety consideration that results from this is the fact that fast moving machinery might appear to stand still in certain lighting, so much so that you don’t have fingers.
In my work, I’m often interested in what frequencies of variation are present in my data. I usually measure these frequencies by calculating a Fourier transform, which is a plot that shows a large spike where different significant frequencies can be found. The figure below demonstrates how the relationship between the sampling rate and the underlying frequency can confuse this measurement. The underlying signal (red line) stays the same, but I increase the rate of observations (blue points) throughout the animation. The result is that the peak in the Fourier transform (bottom panel) moves around, bouncing off the walls before settling down once the signal begins to be sampled at least twice per cycle. This limit is called the Nyquist frequency, and it is equal to half the sampling rate. Signals with intrinsic frequencies below the Nyquist frequency will show up at their accurate locations in the sub-Nyquist part of a Fourier transform, while higher-frequency signals will not.

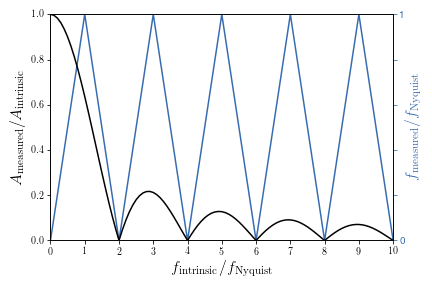
A disturbing consequence is that, without external information, it can be non-trivial to say that the rate at which an observed cycle appears to be reccurring is the accurate one. There are an infinity of discrete, higher frequencies that could possibly describe the observations. In the ideal case, you have good external reasons to expect the frequency to be in the sub-Nyquist regime, as defined by your experimental setup. For all other purposes, you have my code: the python module pyquist can be used to calculate the candidate intrinsic frequencies given an observed frequency, or the frequency you would expect to measure for an undersampled signal. It also contains functions for calculating the expected reduction in signal amplitude caused by the long exposure times associated with a low sampling rate (e.g., though it may appear to rotate slowly, an airplane propeller in undersampled film will usually look blurry—the example above must have been recorded at a high frame rate, with frames removed afterward). I used this code to generate the following plot (Figure 1 in Bell et al. 2017, ApJ, 851, 24), which summarizes the relationships between both the frequency and amplitude measured for a signal given the ratio of its intrinsic frequency to the Nyquist.
Unfortunately, this code doesn’t resolve the ambiguities alone; you’re still going to need to put some external constraints on the system (in my case, I took a small amount of additional data), but pyquist can help to explore the set of possible solutions or to design an experiment that avoids this problem altogether. This code has already proved useful in my more recent projects, and I hope that others might find it helpful too.
Besides, you know you want to from pyquist import superfreq… it’s super fun to type!
Astronomy, statistics, programming in Python, data visualization, data science, and other great icebreakers.
- Bootstrapping a significance threshold for periodogram analysis
- How data sampling affects the Fourier transform periodogram
- Three statistical tests for average spacing among numbers
- Confidence intervals for 2D Gaussian mixture models with contours
- What's the expected average value of a noisy amplitude spectrum?