Flagging multiple conditions in Matplotlib scatter plots
Always seeking more complicated plots (i.e., to encode more information into simple, interpretable visual representations), I have written a script to make scatter plots that indicate the settings of multiple point-by-point binary flags: scatterflags.py. While I’m somewhat dubious about including such figures in refereed publications, I find them very helpful for data exploration (especially in interactive matplotlib windows that I base off the data_browser example).
Here is the basic example from the script header with random data:
import scatterflags as sf
import numpy as np
import matplotlib.pyplot as plt
npts=50
x = np.arange(npts)
y = np.random.randn(npts)
f,(ax0,ax1) = plt.subplots(2,1,figsize=(6,5),gridspec_kw={'height_ratios':[4,1]})
kwargs = sf.scatterflags(x,y,np.round(np.random.randint(1,64,npts)),ax=ax0)
ax0.scatter(x,y,c='0',s=1,zorder=10,marker='*')
ax0.set_xlabel('x')
ax0.set_ylabel('y')
sf.flagbar(cax=ax1,flaglabels=['flag'+str(i) for i in range(6)],barlabel='flags',**kwargs)
plt.tight_layout()
plt.show()
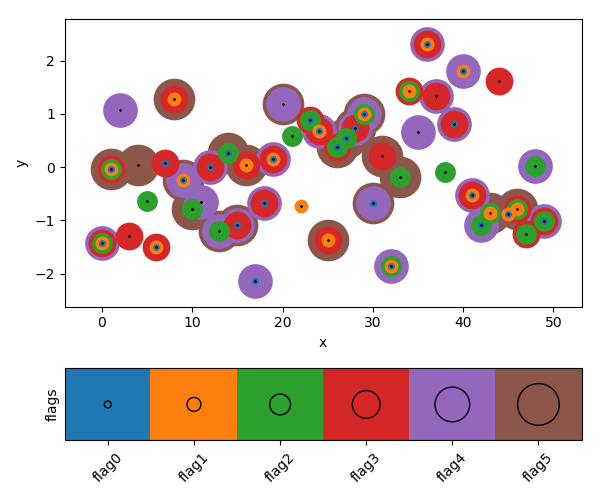
No matter how many flags are set or how crowded this plot gets (in theory), you can visualize all flags that are set corresponding to each data point in this figure.
The script expects all flags for each point to be encoded in a single integer. This number, when represented in base 2, gives a sequence of zeros and ones corresponding to each flag condition. For example, the point with the highest y value has flag values 27 = 16 + 8 + 2 + 1 = 24 + 23 + 21 + 20, and the numbered flags matching these exponents are set.
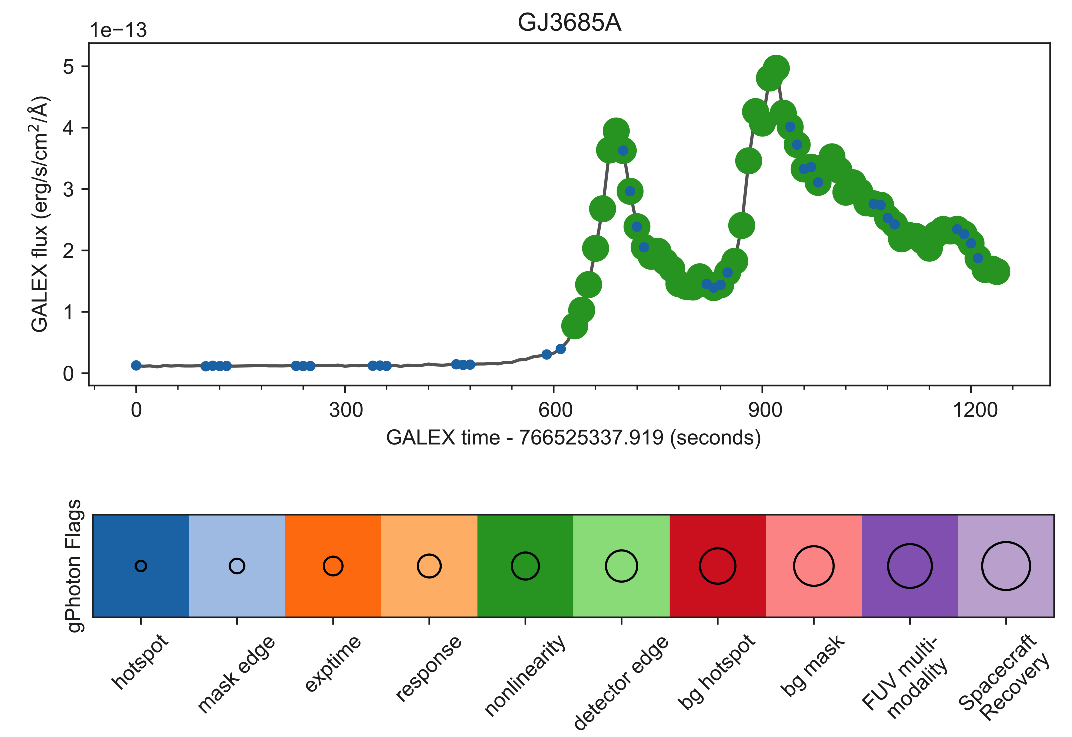
This is a compact way to encode flags with data, and I wrote this script to provide a corresponding visual representation. I encounter bit flags like these in my astronomy research, e.g., with Kepler (Archive Manual, Section 2.3.1.1) and GALEX time series data provided by gPhoton. Finally, here is an example depicting the flags that correspond to the double-flare event of GJ 3685A captured by GALEX. Based on these flags, I would worry that the flux excess during these dramatic flares was underreported as the star brightened into the nonlinear regime of the UV detector (but also occasionally passed over a detector hotspot).

Astronomy, statistics, programming in Python, data visualization, data science, and other great icebreakers.
- Bootstrapping a significance threshold for periodogram analysis
- How data sampling affects the Fourier transform periodogram
- Three statistical tests for average spacing among numbers
- Confidence intervals for 2D Gaussian mixture models with contours
- What's the expected average value of a noisy amplitude spectrum?