Spherical harmonic animations with matplotlib and cartopy
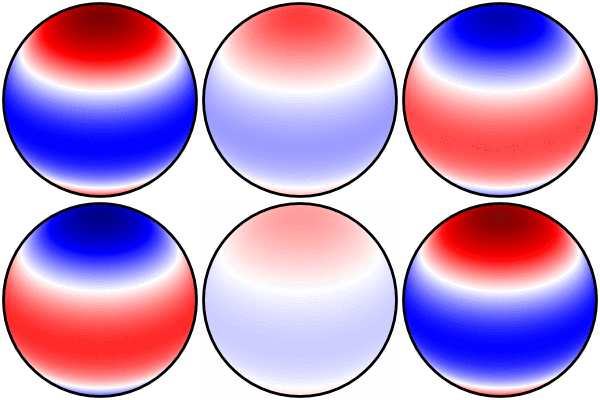
This post demonstrates three Python tricks: computing spherical harmonics, plotting map projections with Cartopy, and saving animations in matplotlib. I bring these together to generate animated gifs of spherical harmonics like the one below. These are useful for visualizing stellar pulsation geometries, and I often display these in talks or lectures. If you want to skip right ahead to using the script I wrote to generate these animations, you can find it here.

Spherical Harmonics
I won’t go into much detail on spherical harmonics (too much detail can be found on Wikipedia and elsewhere). The important thing is that they are commonly encountered in spherically symmetric systems. The patterns associated with pulsation modes in stars are an example from my own work, and they also have prominent application for computing the orbitals of electrons in atoms.
Each spherical harmonic is defined by two quantum numbers, \(\ell\) and \(m\). The number of nodal lines on the surface (lines that are not affected by the harmonic pattern) is equal to \(\ell\), and \(\vert m\vert\) of these go through the poles. The example above shows \(\ell=2\), and \(m=0\). If \(m\neq 0\), the pattern appears to rotate about the poles in a direction that depends on the sign of \(m\). Because there are a total of \(\ell\) nodal lines, \(\vert m\vert\leq\ell\).
Scipy provides a function for sampling the values of spherical harmonics at different longitudes and colatitudes.
import numpy as np
import scipy.special as sp

# Compute spherical harmonic pattern
l=4; m=3
lon = np.linspace(0,2*np.pi,200)-np.pi
lat = np.linspace(-np.pi/2,np.pi/2,500)
colat = lat+np.pi/2
d = np.zeros((len(lon),len(colat)),dtype = np.complex64)
for j, yy in enumerate(colat):
    for i, xx in enumerate(lon):
        d[i,j] = sp.sph_harm(m,l,xx,yy)
drm = np.transpose(np.real(d)) #only interested in real components
Plotting Map Projections with Cartopy
Cartopy is a neat Python package for plotting map data. This allows us to visualize spherical harmonics appropriately on a sphere! I had previously worked out how to do all of this with Basemap, but it seems that Cartopy is slated to replace Basemap.
The following code to display the spherical harmonic computed in the last section highlights just one of Cartopy’s many awesome functions. I really enjoy data visualization, and thinking about map projections is no exception.
import matplotlib.pyplot as plt
import cartopy
import cartopy.crs as ccrs

#Set up figure
fig = plt.figure(figsize=(1,1),tight_layout = {'pad': 0})
inclination = 60 #degrees from pole
plotcrs = ccrs.Orthographic(0, 90 - inclination)
ax = plt.subplot(projection=plotcrs)

#Plot, limiting colors to extreme data values
vlim = np.max(np.abs(drm))
ax.pcolormesh(lon*180/np.pi,lat*180/np.pi,drm,transform=ccrs.PlateCarree(),
                        cmap='seismic',vmin=-vlim,vmax=vlim)

#Necessary function calls
ax.relim()
ax.autoscale_view()

#Save the image
plt.savefig('l4m3.png',dpi=300)
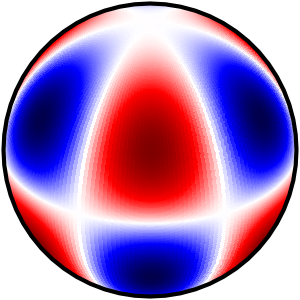
The output looks like this:

Animations with Matplotlib
The plotting library matplotlib offers a couple ways to create custom animations. In my program, I use the FuncAnimation function to redraw the plot for each desired frame. Note that saving the animation to a gif requires imagemagick to be installed.
I animate the \(\ell=4\), \(m=3\) spherical harmonic with the additonal code:
from matplotlib import animation

nframes = 32 #number of frames per cycle
seconds = 2. #desired duration
interval = seconds/nframes

#No initialization needed
def init():
    return

#Animation function to call
def animate(i):
    drm = np.transpose(np.real(d*np.exp(-1.j*(2.*np.pi*float(i) /
                                              np.float(nframes)))))
    ax.clear() #Clear previous data
    ax.pcolormesh(lon*180/np.pi,lat*180/np.pi,drm,
         transform=ccrs.PlateCarree(),cmap='seismic',vmin=-vlim,vmax=vlim)
    ax.relim()
    ax.autoscale_view()
    return

#Animate it and save!
anim = animation.FuncAnimation(fig, animate, init_func=init,
                               frames=nframes, interval=interval,
                               blit=False)
anim.save('l4m3.gif', dpi=200, fps = 1/interval, writer='imagemagick')
And here is the final result:

Spherical Harmonic Animation Script
My script to generate general spherical harmonic animations can be found here. Feel encouraged to use it as widely as you wish. It can be called from the command line with many optional arguments to customize the output. Remember that larger images, more frames, higher latitude/longitude sampling, and higher resolution images (dpi) will increase both the size of the file and the time required to generate it.
ACKNOWLEDGEMENT
When first figuring out how to display spherical harmonics with Basemap, I found a post by Alex J. DeCaria very helpful. That no longer seems to be online, but this author did publish a book called Python Programming and Visualization for Scientists that may be of interest to anyone who enjoyed this blog post.
- Three statistical tests for average spacing among numbers
- Confidence intervals for 2D Gaussian mixture models with contours
- What's the expected average value of a noisy amplitude spectrum?
- High-fidelity plot image representations for machine learning classification
- Fitting features in a power spectrum with least squares and MLE
